Aurora Plot
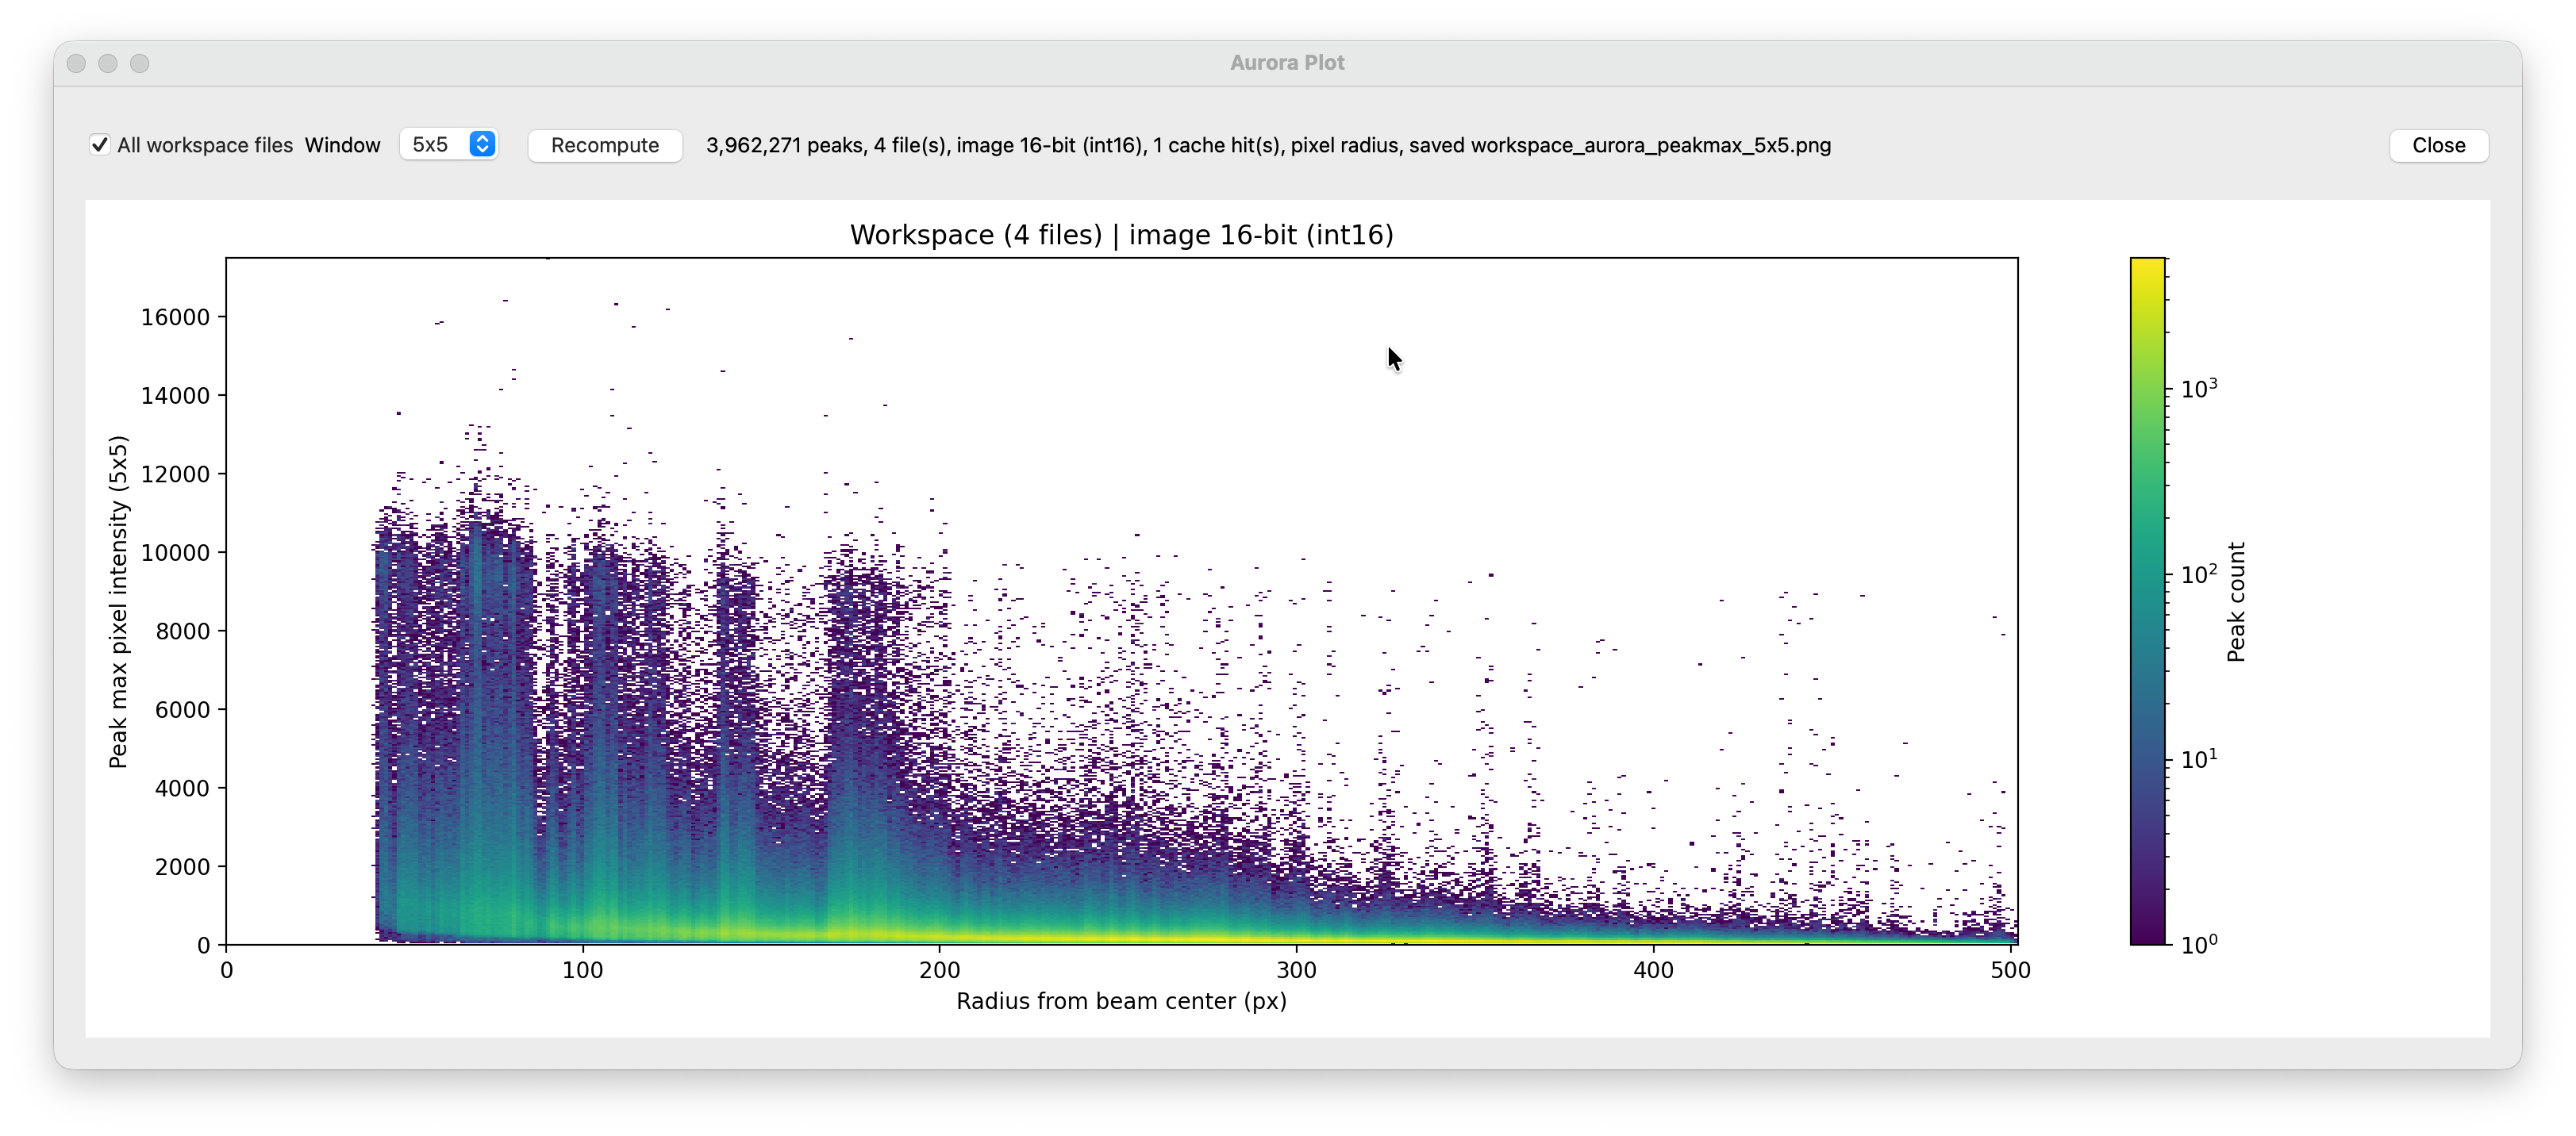
The Aurora Plot shows peak max pixel intensity vs. radius from the beam center as a 2D histogram across all frames in a dataset. It can be used as a tool for checking whether peaks near the beam stop are saturating the detector.
How to use
Open Tools → Aurora plot. The plot is computed automatically for the current dataset and the result is cached to disk. Subsequent opens load instantly from the cache.
Control |
Description |
|---|---|
All workspace files |
Combine data from all datasets in the workspace into a single plot. Only active when more than one file is loaded. |
Window |
Size of the pixel window used to extract the peak maximum around each peak position (1×1 to 9×9, default 5×5). A larger window is more robust to sub-pixel centering errors. |
Recompute |
Discard the cache and recompute from the raw data. |
Close |
Close the window. |
The status bar shows the total number of peaks processed, the number of files, the image bit depth, and the number of cache hits.
Reading the plot
X axis — distance from the beam center in pixels. Each peak is placed at its radial distance from the per-frame beam center (or the fixed center from the INI if center finding has not been run yet).
Y axis — maximum pixel value in a small window around the peak position, at full detector bit depth.
Color — peak count on a log scale. Dense regions (yellow/green) contain many peaks at that radius and intensity; sparse regions (dark blue/purple) contain few.
A horizontal band of high-intensity peaks near the top of the plot indicates saturation at those radii. The intensity at which the detector saturates is visible as a hard ceiling where peak density suddenly drops to zero — this is the detector’s ADU limit for the given bit depth. Peaks piling up against that ceiling are saturated and should be excluded by setting a max_adu cutoff during merging, or by increasing min_res in peak finding to stop collecting peaks that close to the beam center.
Requirements
Peak finding must have run first (nPeaks, peakXPosRaw, peakYPosRaw must exist in the HDF5). The beam center is read from center_x/center_y if available, otherwise from peakfinding_x0/peakfinding_y0 in the INI.
Cache
Results are saved to aurora_plots/<stem>_aurora_peakmax_<N>x<N>.npy next to the HDF5 file. A PNG of the plot is also saved alongside it. Change the window size or click Recompute to regenerate.